Alstan Jakubiec and Christoph Reinhart (funded by the NSF under Grant No. 1038264; 2011 - 2012)
Solar Energy Paper
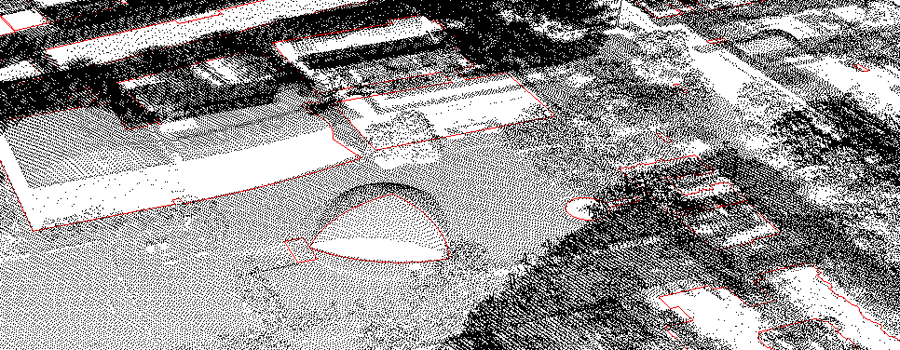
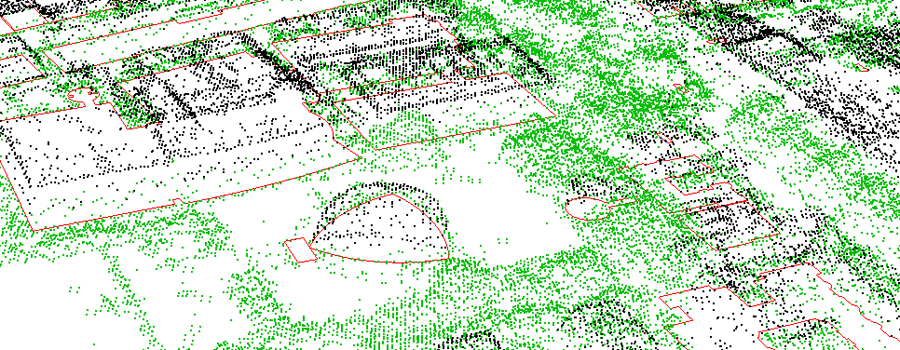
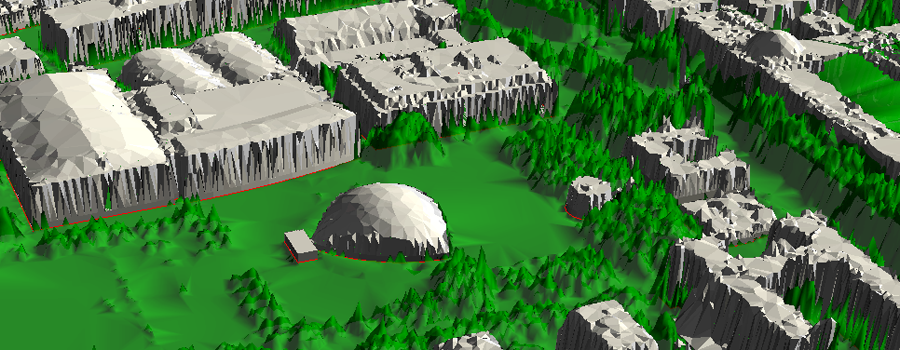
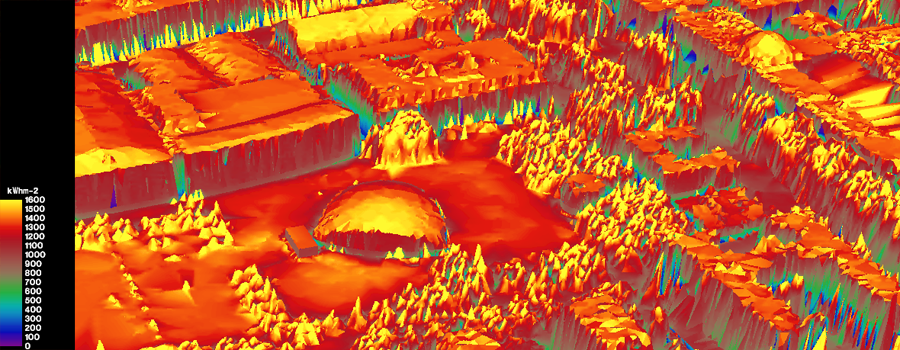
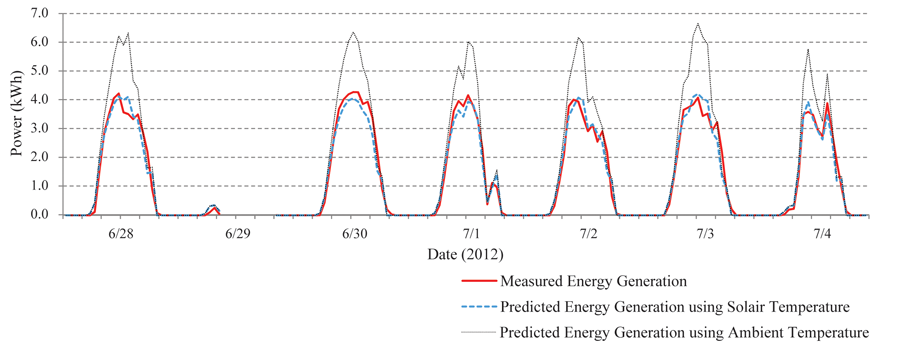
In this project we developed a new simulation-based technique to reliably predict the annual electricity yield from an arbitrarily oriented and obstructed photovoltaic (PV) array located anywhere on the planet. The technique considers detailed surrounding geometry such as trees and buildings, hourly direct and diffuse solar radiation data as well as instantaneous solar cell efficiencies due to varying roof temperatures. Required simulation inputs are standard local weather station data as well as LIDAR point clouds.
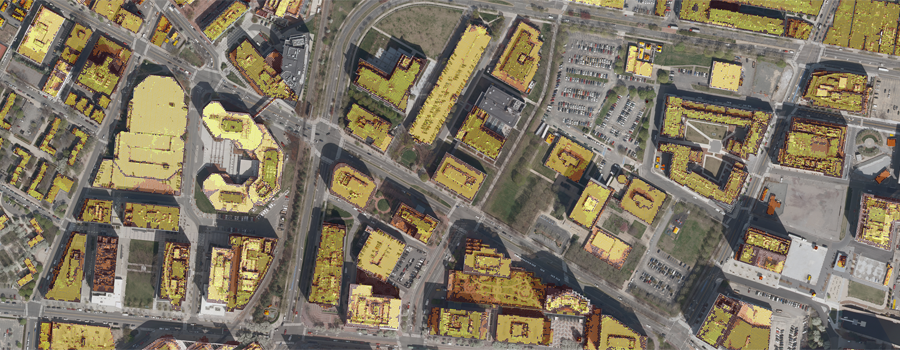
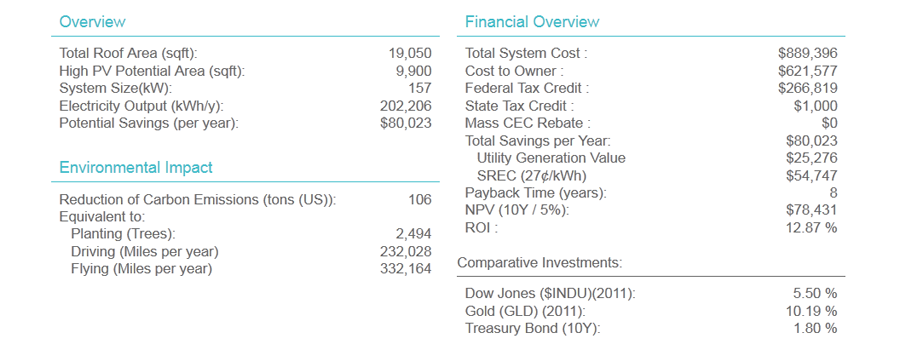
As a proof of concept, the we teamed up with the City of Cambridge and Eduardo Berlin from Modern Development Studio and generated an interactive Solar Map of Cambridge. MIT created an annual electricity yield map from PV for all Cambridge rooftops. The data shows which roofs in Cambridge have excellent, good, poor and no solar potential for PV. The map has a resolution of 5' by 5'. Modern Develoment Studio devleopped the online viewer and a financial analysis module that considers federal and state incentives for residential and commercial PV installtions as well as estimated payback times for PV systems with excellent or good solar potential. The City of Cambridge provided the underlying LiDAR data and Google ortho-images. The basic steps of the simulation technique are shown below. More details can be found here.
MIT's portion of the project has been supported by the National Science Foundation under Grant No. 1038264. Any opinions, findings, and conclusions or recommendations expressed in this material are those of the author(s) and do not necessarily reflect the views of the National Science Foundation.

Climate Driven Design volume I go to Building Technology Press>>

MOOC on Sustainable Building Design more>>

SDL Weather station
Our weather station on top of MIT Building 1 has been collecting data since March 2017 more>>